Dependency Risk
Explore0.55Medium Risk
0-1 weighted average
V. LowV. High
The original risk screening tool
From water constraints to permit delays, nature could already be affecting your operations. The question is where. Global Nature Risk screens your whole portfolio, so you don’t find out too late.
 Book a demo
The original risk screening tool from NatureMetrics
From water constraints to permit delays, nature could already be affecting your operations. The question is where. Global Nature Risk screens your whole portfolio, so you don’t find out too late.
Book a demo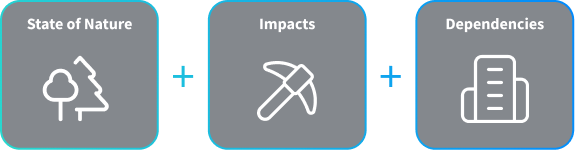
of global GDP depends on nature, and most businesses do not realise their exposure
to screen thousands of sites, not months
threatened species detected
of validated, ground-truth data
of global GDP depends on nature
to screen thousands of sites, not months
threatened species detected
of validated, ground-truth data
Global Nature Risk is the only tool that combines geospatial datasets with a proprietary eDNA database, to create risk scores you can trust, built on real biological evidence.
From early risk screening to ongoing compliance - we can support you to plan smarter, approve faster and monitor your portfolio with confidence.
Speak to an expertOne
Reach out to the team

Book a call with the team for a full demo and to discuss trial opportunities.
Two
Upload your portfolio

Share your site locations and activity codes. Global Nature Risk does the rest. Free your team up from GIS data analysis to focus on reducing risk.
Three
We score every asset

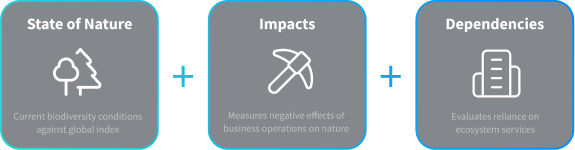
State of Nature, Dependencies, and Impact scores are generated for each site so you know where nature risk is concentrated.
Four
Act on what matters

Filter the heatmap, drill into single-site reports, export TNFD-aligned evidence packs, and validate the highest-risk sites.
of global GDP depends on nature
to screen thousands of sites, not months
threatened species detected
of validated, ground-truth data
The same 0–1 methodology. Different jobs-to-be-done depending on where you operate.

Protect operating licences. Direct closure and remediation spend where it counts. Spot water-security risk before forecasts feel it.
Job-to-be-done: Avoid permit revocations and project delays from noise, water-quality, or ecosystem-condition triggers.

Screen hundreds of sites before boots-on-the-ground spend. Identify protected area proximity, water dependency and ecosystem sensitivity before capital commits.
Job-to-be-done: Front-load due diligence on protected areas and ecosystem condition to cut regulatory back-and-forth.

Find degrading natural buffers before failure events force reactive spend. Automate double- materiality. Generate the evidence Green Bonds and sustainability-linked finance need.
Job-to-be-done: CSRD / ESRS materiality at portfolio scale, without the manual workload.

See the nature exposure inside your supply chain, from soil depletion and water stress in raw-material catchments to ecosystem pressure on sourcing regions, before it shows up in yield or COGS.
Job-to-be-done: Map supply-chain dependency and impact hotspots to meet TNFD & CSRD without rebuilding the data layer.

Score prospective acquisitions and existing holdings for nature exposure across state of nature, impacts and dependencies. Decide where deeper due diligence is warranted before capital is on the table or tied up.
Job-to-be-done: Rapid, consistent nature risk screening across target portfolios pre-LOI and pre-close.

Turn site-level biodiversity data into the evidence funders and investors need to release capital. Know which sites face the highest permanence risk and focus your resources where the ecological stakes are highest.
Job-to-be-done: Give funders the portfolio-wide risk evidence they need to commit capital with confidence.
Find out why more than 600 organisations in 126 countries choose NatureMetrics as their nature intelligence partner.