Restoration Tracker: Finally, a Simple Way to Robustly Measure and Track Progress Towards Restoration Success
As key members of the Products Team at NatureMetrics, we are excited to introduce you to Restoration Tracker, a product that we believe will transform how we measure and monitor ecosystem restoration.
Having spent the past 20 years working in ecology and conservation, one challenge has consistently stood out: how do we accurately measure the success of ecosystem restoration? Ecologists have long lacked a universal method for quantifying the quality of ecosystem health, hindering the development of standardized tools to monitor habitat restoration progress. Moreover, Project Managers have been challenged with comparing restoration efforts across various land assets (to guide future planning) and aggregating land survey data at the portfolio level (for reporting purposes).
Introducing Restoration Tracker
Restoration Tracker is NatureMetrics’ solution to this long-standing challenge of monitoring restoration projects. It offers a standardized approach that's both scientifically robust and easy to interpret. Its key features are:
A restoration score (on a scale of 0-1) for each managed asset, where a score of 1 indicates an area is 100% restored
Quality Hectares, the number of high-quality hectares in the monitored area, this is essentially multiplying the restoration score by the extent of the area being restored
What excites us most about Restoration Tracker is its wide applicability. It’s been designed to function across multiple ecosystem types, currently covering over 70% of the terrestrial realm (following the IUCN Global Ecosystem Typology). From heathlands to tropical and temperate forests, and savannas, the broad scope of Restoration Tracker enables something we've never had before: the ability to quantify restoration progress across diverse projects, even in different parts of the world.
An Ecology Director Perspective
Restoration Tracker is the type of product and methodology the world needs, and the world is waking up. It summarises complex biodiversity data into simple scores, but it doesn’t forget its ecological roots. Some other products on the market make similar claims, but usually they are either not built on strong ecological principles, or they provide only extremely broad indicative results based on highly generalised models (which as ecologists know have very limited ability to actually tell you anything!). It is no small feat to design, test and build a methodology that you can really stand behind as an ecologist – something that you believe can be used anywhere in the world, across multiple ecosystems, and still provide results that you can rely on. Restoration Tracker is that methodology.
NatureMetrics is highly indebted to the skilled members of the team that were able to achieve this, bringing together soil ecology, molecular ecology, data pipeline engineering and statistical modelling. We have tested Restoration Tracker across multiple environments, using hundreds of samples, in different client contexts and different ecosystems. In all cases, Restoration Tracker produces the expected results.
But, what are expected results in the realm of ecological monitoring?
Well, in ecology it is all about context. We have seen across chronosequences of restoration in areas in different phases of succession, that
where restoration has not started the scores produced are very low
where restoration, such as extensive tree planting is recent (1 year) the scores increase very quickly. We would expect that as large-scale tree planting is essentially an entire conversion of one habitat to another
after a couple of years the scores do increase but not as dramatically, which we would expect as no conversion is happening but trees are maturing, and alongside them the fungal, invertebrate and bacterial communities are progressing through succession
forests that have been well managed, or indeed have just been largely left alone, for many years (decades) get very high scores approaching the top score of 1.
If we take samples from a reference forest and compare them against other samples in the same forest we get scores above 0.97
The fact that the methodology consistently provides expected results across different ecosystems lends more and more credence to the fact that Restoration Tracker scores are actually reflecting what is happening in the ecosystem.
The data analysis under the hood of Restoration Tracker is an innovation on top of ecological principles and existing modelling approaches that are published almost daily in scientific papers, but rarely in a format that can be easily understood by non-ecologists – such as ordination plots (in all their forms), p-value type tests or effect sizes. The innovation is transforming these extremely well-founded data analyses outputs into simple scores that retain robustness and do not hide the real meaning of the data. Restoration Tracker bridges a gap between the usual scientific outputs and something that anyone can immediately grasp and understand, without needing to do a PhD in ecology.
What also really excites me about Restoration Tracker, is its alignment with emerging frameworks, particularly with the UN SEEA – Ecosystem Accounting framework, which forms the backbone of many other approaches. We have spent many, many hours reviewing hundreds of pages of documents around this framework. It is an excellent framework and no doubt it will be more and more widely adopted. A couple of key points from the UN SEEA documentation and references within it are:
Ecosystem condition is often defined by measuring the similarity (or the distance) of a current ecosystem to a reference state, such as minimally impacted by people or a historical state
This is exactly what Restoration Tracker does
Characteristics that concern specific functional groups (e.g., pollinators, nitrogen fixers, predators, decomposers, etc.) should be considered as functional state characteristics.
The functional profiles generated by Restoration Tracker fit perfectly into this definition and we can answer questions like – does the management site have the expected proportion of nutrient cyclers, pathogens, or symbiotic fungi?
Overall, Restoration Tracker is a product I believe is first-in-class and hope that clients can see the value and start applying it to projects around the world.
How it works
The essence of Restoration Tracker is to collect soil eDNA samples from multiple sites, including a Reference Site that represents a target condition (e.g. a mature or high-value oak woodland). The output index score describes how similar each site was to the Reference Site, based on thousands of soil organisms, including fungi, bacteria and invertebrates. The objective is for management sites to become increasingly similar to the reference condition over time.
Who is it for?
Corporate entities involved in operationalizing Nature Positive commitments
Environmental managers seeking actionable insights to guide restoration strategies
Conservation organizations monitoring the success of their restoration projects
Policy makers and regulators evaluating the effectiveness of restoration initiatives at larger scales
Project developers and landholders developing biodiversity credits or nature standards
How did we build it?
We trialed numerous existing approaches from the scientific literature to generate scores that aligned with habitat restoration progress. While some methods performed better than others, none of them provided consistent results across all our tests and datasets, which included soil eDNA data from hundreds of samples across multiple countries and ecosystems. Ultimately, we adapted existing robust scientific methodologies to create Restoration Tracker. Our approach compares entire communities of species, including those that haven't been formally assigned species names yet. This gives us a more comprehensive view than counting and comparing species numbers and accounts for the particular species shared with Reference Sites.
In addition to comparing community composition, we have incorporated the comparison of the ecological functions of detected species. This ensures that Restoration Tracker accounts for the re-establishment of ecological functions in managed assets, an integral component of restoration ecology. From our internal testing, we have encountered instances where the ecological functions of a habitat are being restored, while compositional differences in species still exist.
We will soon be posting case studies showing further field validations, so watch this space for those!
Some of the more technical testing
When designing Restoration Tracker we returned to the high-level question of ‘what is good?’ when considering species communities. When comparing against a reference site, we defined ‘good’ as having an equal probability of detecting a given species at a site being restored compared with the reference site. This necessitates restoring each given species at a site being restored, but also replicating what species are common and which are rare, ensuring the active restoration of the overall community. This concept aligns with how ecologists think about beta diversity (the diversity among sites/samples), where ‘good’ is simply when the beta diversity observed between the reference site and the sites being restored mimics the beta diversity observed within each site.
With this defined, we were able to simulate restoration gradients of hypothetical species communities, basing these on real data in terms of the number of species and relative detection probabilities. Using these simulated datasets, we explored a variety of approaches for scoring the data on a 0-1 scale. We were also able to change the simulation conditions to ensure approaches were robust when looking at different numbers of samples or species.
Having validated approaches on simulated datasets, we were able to test them further using real projects. This allowed us to identify any shortcomings or oddities, at which point we returned to the simulated data and iterated the methodology. This iteration process led to a method that is robust against different project scales, different taxonomic groups, and across species and function datasets.
By considering whole communities of species, combined over multiple samples taken across a site, our methodology is designed specifically to account for the natural variability among samples (beta diversity). This is an essential requirement for designing metrics that align with biodiversity reporting frameworks.
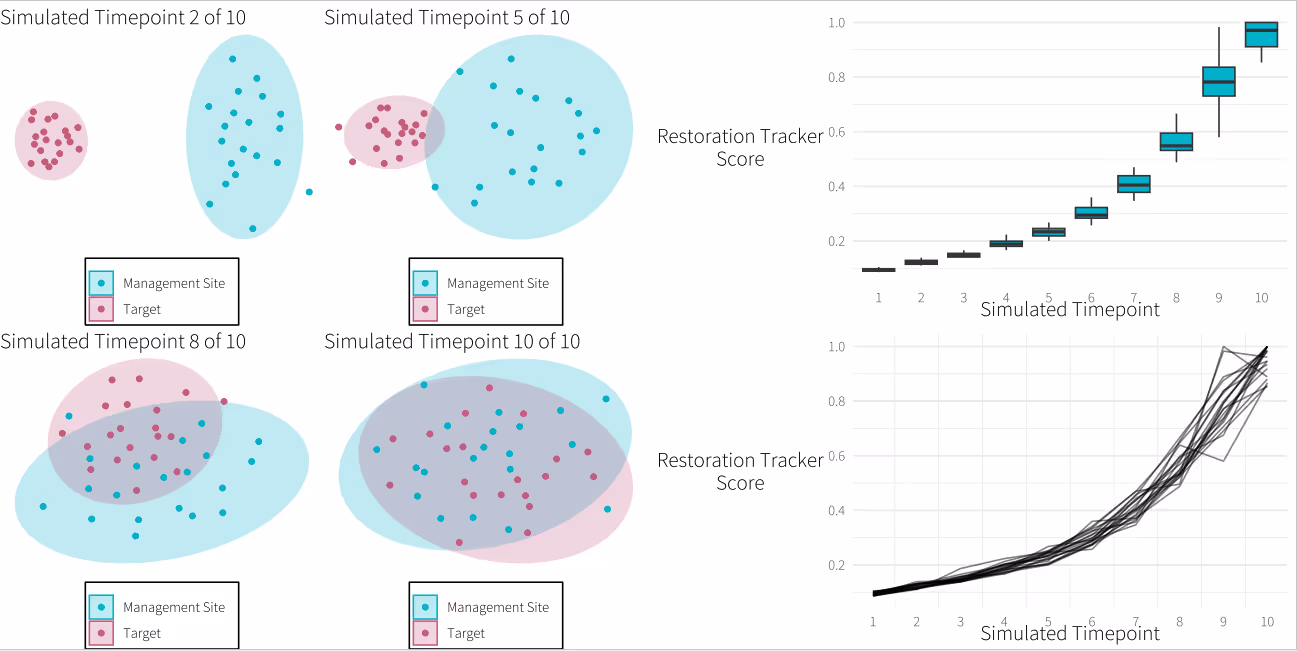
The ordination plots on the left show simulated communities becoming more similar over time. We simulated 10 timepoints where communities were designed to be highly similar by timepoint 10. The ordinations show a hypothetical eDNA study where each point is an individual sample and the two ellipses show a hypothetical management site being restored (blue) and a reference site (red).
The boxplots on the right show our Restoration Tracker score calculated across this simulated dataset, for all timepoints from 1 to 10. The variability at each timepoint comes from repeatedly re-running simulations to allow for variation in the restoration process. The lines show the individual restoration trajectories across 20 simulation runs, where we are joining the line between each Restoration Tracker score calculated within each simulation at each timepoint.
We will soon be posting case studies showing further field validations, so watch this space for those!
Looking Ahead
Restoration Tracker is currently being applied to numerous exciting projects across various ecosystems. While we can't share specific details yet, we're eager to present these case studies in the near future.
As we continue to refine and expand Restoration Tracker, we are particularly excited about its potential applications beyond terrestrial ecosystems. In fact, Restoration Tracker has been built in such a way that it can essentially be used for any ecological community data, so can be adapted for birds, fish and other species groups. We're already working on extending its capabilities to aquatic and marine environments, and the core functionality will also play an important part in Ecosystem Condition monitoring.
Availability, Support, and Pricing
Restoration Tracker is now available for commercial use, backed by NatureMetrics' comprehensive support services. These include initial consultation and project scoping, survey design assistance, training for field teams, data interpretation support, and access to our user-friendly platform for viewing results and tracking progress over time.
Pricing for Restoration Tracker is calculated on a site area basis, with costs per hectare decreasing as the size of the monitored area increases. This scalable pricing model, combined with included platform access and survey design services, makes Restoration Tracker a cost-effective solution for restoration monitoring projects of all sizes.
From COP30 in Belém, Pippa Howard, Chief Nature Strategist at NatureMetrics, examines how the gap between measuring nature and managing it strategically is where billions in capital, competitive advantage, and operational resilience will be won or lost by 2030.
By clicking “Accept”, you agree to the storing of cookies on your device to enhance site navigation, analyze site usage, and assist in our marketing efforts. View our Privacy Policy for more information.


.png)